Christmas in July
Christmas in July
Looking at Yahoo finance ticker ^GSPC (S&P 500 Index).
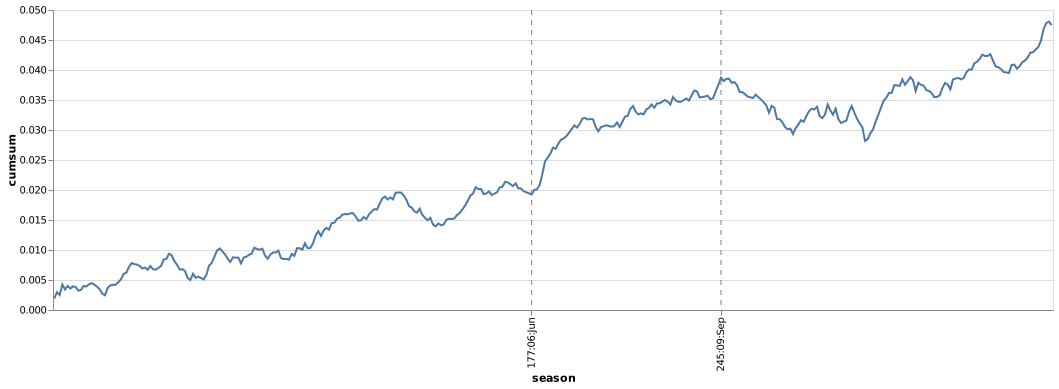
The seasonal chart for July is typically strong.
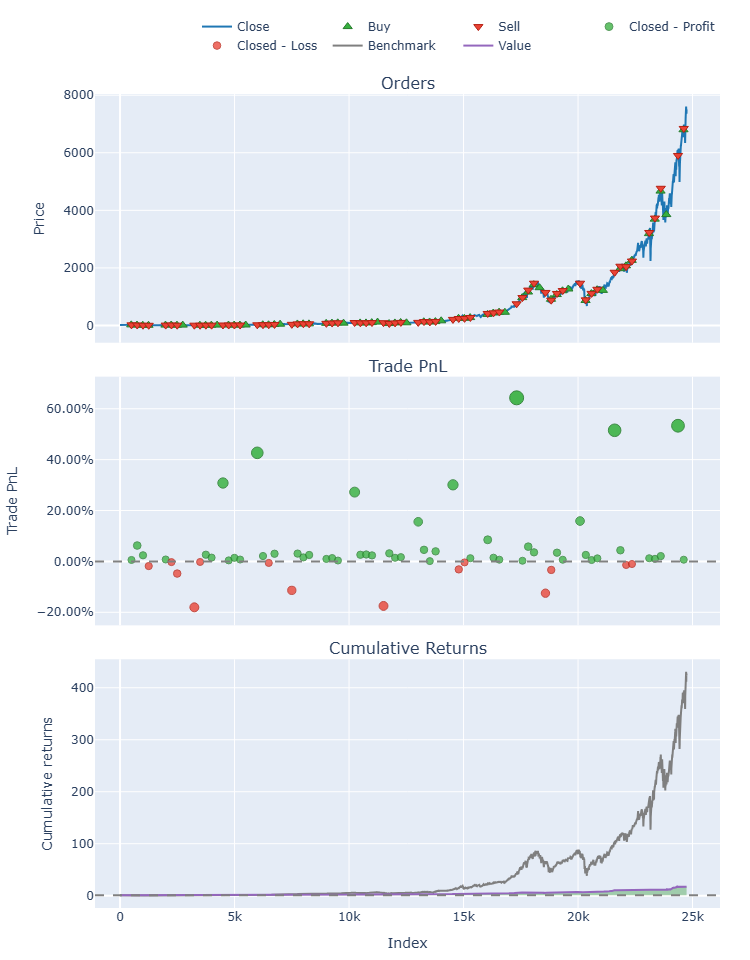
Not as strong as the better known Santa Claus rally. However, as this VectorBT backtest shows. It was profitable 78% of 66 trades with the average winning trade better than the losers.
Will this July bring a Christmas present for the Southern Hemisphere?
Start                                                  0
End                                                24740
Period                               24741 days 00:00:00
Start Value                                        100.0
End Value                                    1737.109735
Total Return [%]                             1637.109735
Benchmark Return [%]                        42273.896065
Max Gross Exposure [%]                             100.0
Total Fees Paid                                      0.0
Max Drawdown [%]                               36.446456
Max Drawdown Duration                 3465 days 00:00:00
Total Trades                                          66
Total Closed Trades                                   66
Total Open Trades                                      0
Open Trade PnL                                       0.0
Win Rate [%]                                   78.787879
Best Trade [%]                                 64.309066
Worst Trade [%]                               -18.062015
Avg Winning Trade [%]                           8.164185
Avg Losing Trade [%]                           -5.468177
Avg Winning Trade Duration    91 days 09:13:50.769230769
Avg Losing Trade Duration              117 days 00:00:00
Profit Factor                                   8.173835
Expectancy                                     24.804693
Sharpe Ratio                                    0.523664
Calmar Ratio                                    0.118025
Omega Ratio                                     1.167953
Sortino Ratio                                   0.763042