Election cycle
Elections and the high cost of living
Seasonal charts can be useful to observe how patterns typically occur over time. The patterns over the election cycle likely describe how politicians plan policy. Should interest rates favour growth or reduce debt. Does the stock market show a strong economy. How will decisions made affect re-election.
SP500
If we look at the seasonal chart we can see that September during the midterm year is typically a good time to buy.
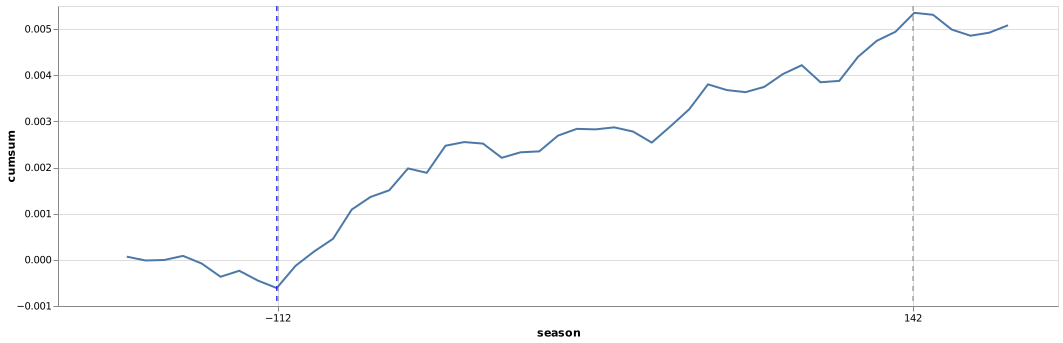
If you buy the SP500 in October and sell July 3 years later. You make a profit 83% of the time.
There were a spate of losing years in 1933, 1941, 1949. The aftermath years of the 1929 wall street crash and the great depression.
That only losing year after that was 2009, the year after the global financial crisis.
The profit factor of trades is 10. Meaning on average you make 10 times your losses per trade.
Gold
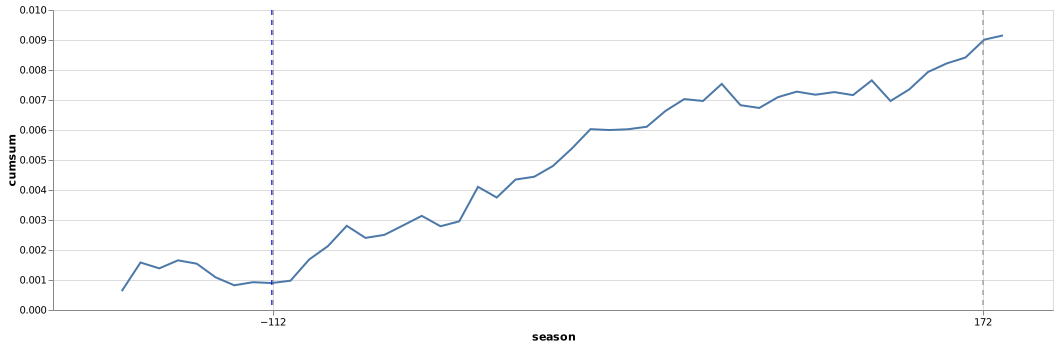
Gold is also pretty strong in this range although gold only really kicks off a month later. Possibly used as a hedge versus stocks.
Current environment
Given the parallels with today’s market and the dotcom bubble. There’s always a chance that there could be crisis looming. It’s hard to bet completely against the market finding a way to keep moving up and right however.